Every investor uses the price-to-earnings ratio. From my discussions with private investors to professional investors, the P/E ratio is always mentioned.
But what does a P/E ratio actually mean?
Do you use it to value a company?
Can you compare companies using the P/E ratio?
Is it a good idea to compare the current P/E ratio to its historical values?
Let’s uncover the mysteries by diving deeper into what drives the P/E ratio.
A quick definition
The price-earnings ratio is defined as follows:
or if we divide by the total number of shares outstanding (including dilution)
The price or market cap is usually fixed. What you can choose are the earnings:
Last annual net income from the annual report
Trailing twelve-month net income
Forward annual net income
That makes 3 different P/E ratios.
When the PE ratio changes, let’s say it is decreasing it could be that:
The market price stays the same but earnings are increasing
The market price decreases and earnings stay the same
The market price decreases while earnings are increasing
Enough with what you probably already know, let’s go deeper
Pricing versus Value
Let’s get something out of the way immediately. The P/E ratio is a pricing multiple. It is related to the price the market is assigning to a stock.
The value of a company is the present value of its future discounted cash flows.
Earnings are not cash flow.
Thus it seems that a low P/E ratio says nothing about the value of the company. It only gives an indication of how the market is pricing the company in relation to its earnings performance.
The P/E ratio is a shortcut to the process of valuation.
Takeaway n°1: Pricing does not equal valuation. A P/E ratio or any pricing multiple is a shortcut to the valuation process.
Remember:
Although Elon Musk popularized first principles thinking, the discussion below is based on prior work published by professors Merton Miller and Franco Modigliani and of course Michael Mauboussin. Credit goes to them. I was inspired by a great article written by Thomas Chua (www.steadycompounding.com).
A first principles approach to valuation
The value of a company can be divided into 2 parts:
A steady-state value component
A future growth value component
In other words, a company is investing capital to generate a certain return.
The steady-state value assumes that adding incremental invested capital will neither increase nor decrease these returns (the future growth component equals 0)
The company’s engine is humming. It is working in steady state operation.
The future growth value equals the excessive returns you can create and how long you can sustain these. The company will need a positive spread, a return on incremental invested capital(ROIIC) that surpasses the cost of capital(WACC).
You’re pushing in the gas pedal. The engine speeds up. Is the distance or speed traveled positive towards the energy and effort injected? The engine is now operating above steady state operation.
The advantages of splitting the value of a company into two parts are two-fold:
It allows you to isolate the growth aspect and how much you are paying for it
You can measure the impact of this growth. Companies with a large spread and invested capital will derive an important part of their value from growth.
Takeaway n°2: The value of a firm can be split into a steady state and a growth component.
Let’s take a closer look at the definitions and their impact:
General breakdown
The steady-state component is defined as follows:
with NOPAT being Net Operating Profit After Taxes.
The first part assumes the business will generate earnings (normalized) forever.
The growth part can be written as:
As you can see, there are 3 main drivers for future value:
The spread between the ROIIC and WACC
The magnitude of the investment
How long or the duration the company can earn returns above the cost of capital
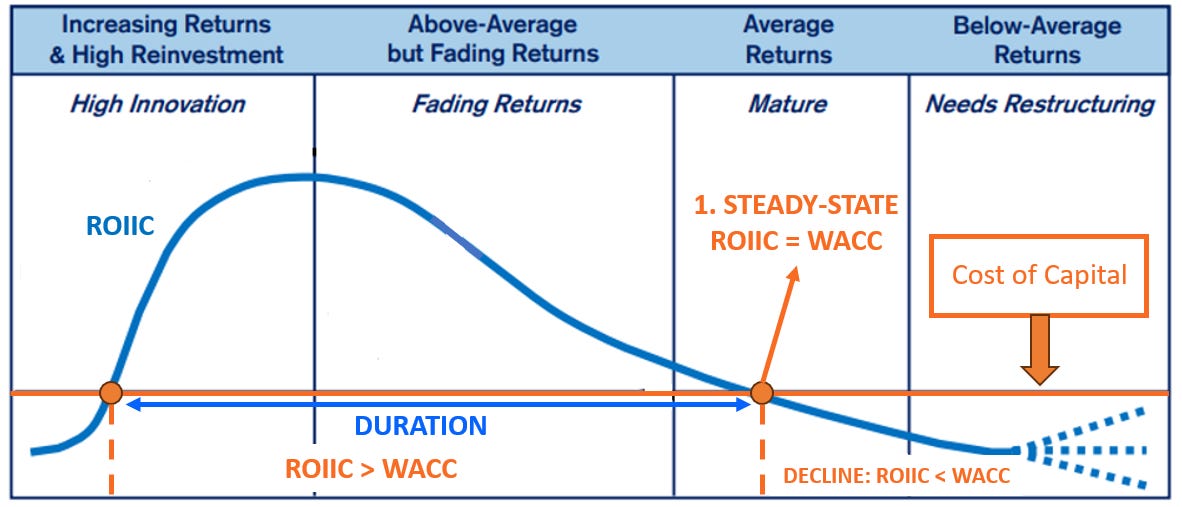
This goes back to the competitive life cycle we discussed before:

When a company is thriving and growing, it has a return on incremental invested capital above its cost of capital. You’ll find the 2 components in the value of the firm. The growth component will be positive.
But as competition increases, and returns decrease, at a certain moment, the company will have a ROIIC that equals the cost of capital. The company has now arrived in a steady state of operation. The growth component is now zero.
Once the business eventually goes into decline, the return on incremental invested capital will be smaller than the cost of capital. The growth component is now negative. Value is subtracted.
Here’s a simplified definition of ROIIC assuming that all the increase in NOPAT is due to last year’s investment.
With year 2 being for example this year, and 1 the previous year.
It determines how efficiently a company grows.
Takeaway n°3: A company has a competitive life cycle. ROIIC versus the cost of capital will determine growth, steady state, or decline.
The steady-state component
Consider a company is in a steady state, its ROIIC equals the cost of capital. If we assume 100% equity financing, the steady-state or commodity P/E ratio is as follows:
In other words, the steady-state or commodity multiple is the price you would pay for one dollar of earnings into infinity, assuming no value creation.
The dean of valuation, Professor Damodaran, has calculated the cost of equity in the US for the S&P 500 over the last few years. Here’s what the Steady State P/E-multiple looks like:

So the steady state P/E ratio has been between 11 and 12 for the last 30 years.
Takeaway n°4: The steady-state P/E ratio for the S&P500 is about 12 but varies throughout history.
If we assume the steady-state P/E ratio is about 12, then we can say that the market assumes the company is creating value above that ratio.
If the stock price is trading below that ratio then there is no value creation or future value creation is unsustainable.
What can we conclude by looking at the drivers of the steady-state P/E ratio?
P/E ratios are a product of:
The equity risk premium
Inflation and interest rate expectations
The business cycle
Tax rates
Quality of earnings
Growth prospects and investing opportunities
All these factors change over time. Which means the P/E ratio does too.
Takeaway n°5: Several factors influence the P/E ratio. Understand this when using pricing multiples.
What does this mean in practice?
Consider the following statements:
The P/E ratio is low compared to the company’s history. Thus the company is cheap. I think it will recover to its previous P/E ratio! Here’s an example of a company in Poland: Eurotel. Would you buy it?
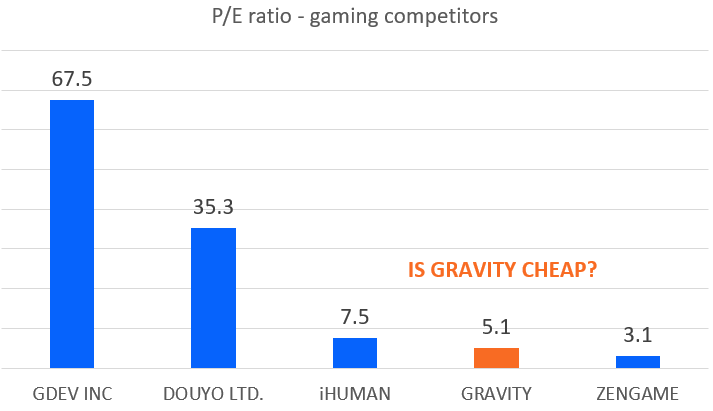
The company has a much lower P/E ratio than the others in the industry. The company is cheap. Here’s an example of a company called mobile game developer and publisher called Gravity (Ticker: GRVY) Gravity is trading pretty cheap compared to it’s competitors. Is it actually cheap?
I’ve completed my discounted cash flow (DCF). I’ll use a pricing multiple to determine terminal value based on its average historical multiple!
I’m not saying you cannot use a P/E ratio, just be mindful of the value of the P/E ratio you’re using and why you’re using it. Maybe the P/E is low now because it has declining ROIIC versus its cost of capital. Then the company is not necessarily cheap.
Based on competitive forces, do you think it’s realistic to choose the terminal value in your DCF based on a historical average? Maybe the better multiple would be the steady-state one, considering the business, in the end, will only earn a return equal to the cost of capital.
As Professor Bruce Greenwald says. If every company produces toasters and is earning high ROIICS, more companies will start producing toasters until all excess returns have been eroded away. As Professor Greenwald so eloquently says:
In the long run, everything is a toaster
Migration towards a steady state will occur due to competition. The rate at which it occurs depends on barriers to entry in the industry, the rate of technological change, etc.
If future prospects on ROIIC and growth are similar to the past, only then may you compare P/E ratios and maybe assert that a return to the past is possible.
There are several things we can take away from this discussion:
Takeaway n° 5: Be careful when comparing companies using P/E ratios. If ROIIC and other factors are different, you’re comparing apples to oranges.
Takeaway n° 6: Comparing the current P/E ratio to the past has a low predictive value. Several factors influence the ratio and change over time.
Bonus takeaway: Tread carefully when using pricing multiples in the terminal value on your DCF. How did you choose it? Did you consider the competitive life cycle of the company?
The growth component
Let’s reiterate the previous definition:
There are 3 main drivers for future value:
The spread between the ROIIC and WACC
The magnitude of the investment
How long or the duration the company can earn returns above the cost of capital
ROIIC versus NOPAT growth
The future value creation formula shows you first have to think about ROIIC versus WACC and thus future competition instead of thinking about growth first.
If a company cannot generate a spread, the growth term goes to zero, and thus growth does not matter.
In other words, a company can grow its earnings per share, and still destroy value.
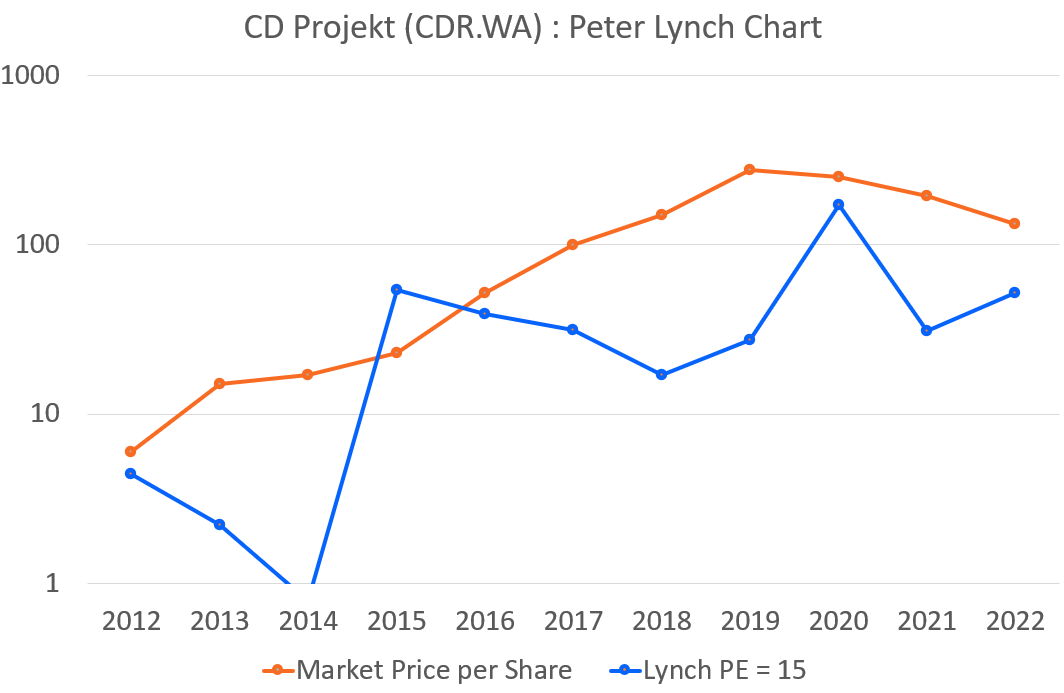
Peter Lynch popularized the P/E ratio of 15 with the Peter Lynch graph:
But there are multiple ways to reach a P/E of 15. If the cost of capital and duration are chosen equal, then here are 3 combinations of NOPAT growth and ROIIC that lead to the same P/E-ratio:
Takeaway n°8: There are multiple paths towards a P/E ratio of 15
The beauty of the Peter Lynch chart is its simplicity. And buying at a low P/E does mean market sentiment is low.
In a Morgan Stanley report, Mauboussin and Callahan went even further in their analysis. They modeled the impact of ROIIC and NOPAT growth on the P/E-multiple.
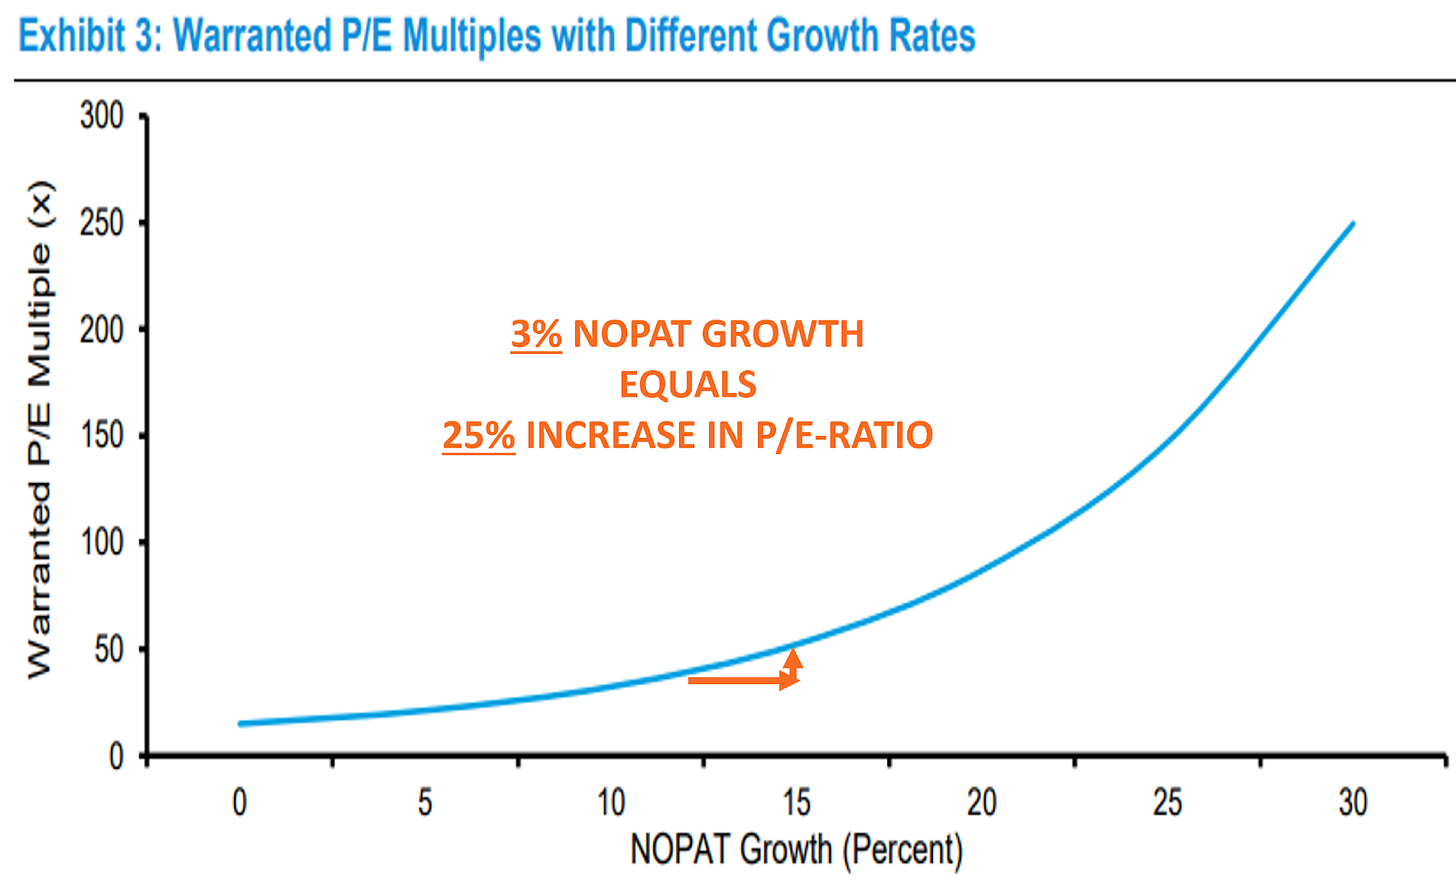
Assume a fixed spread (they used 20% - 6.7%), and forecasting period. Here’s what happens to the P/E ratio when NOPAT growth increases:
Because your spread is positive, the company is not in a steady state. When NOPAT growth increases, the P/E ratio increases rapidly.
It is important to recognize that a small change in NOPAT growth has a bigger impact on the P/E ratio. This is not a simple linear relation.
Here an increase of 3% in NOPAT growth rate increases the ratio by 25%.
Takeaway n°9: A small change in NOPAT growth can lead to a big change in P/E ratio
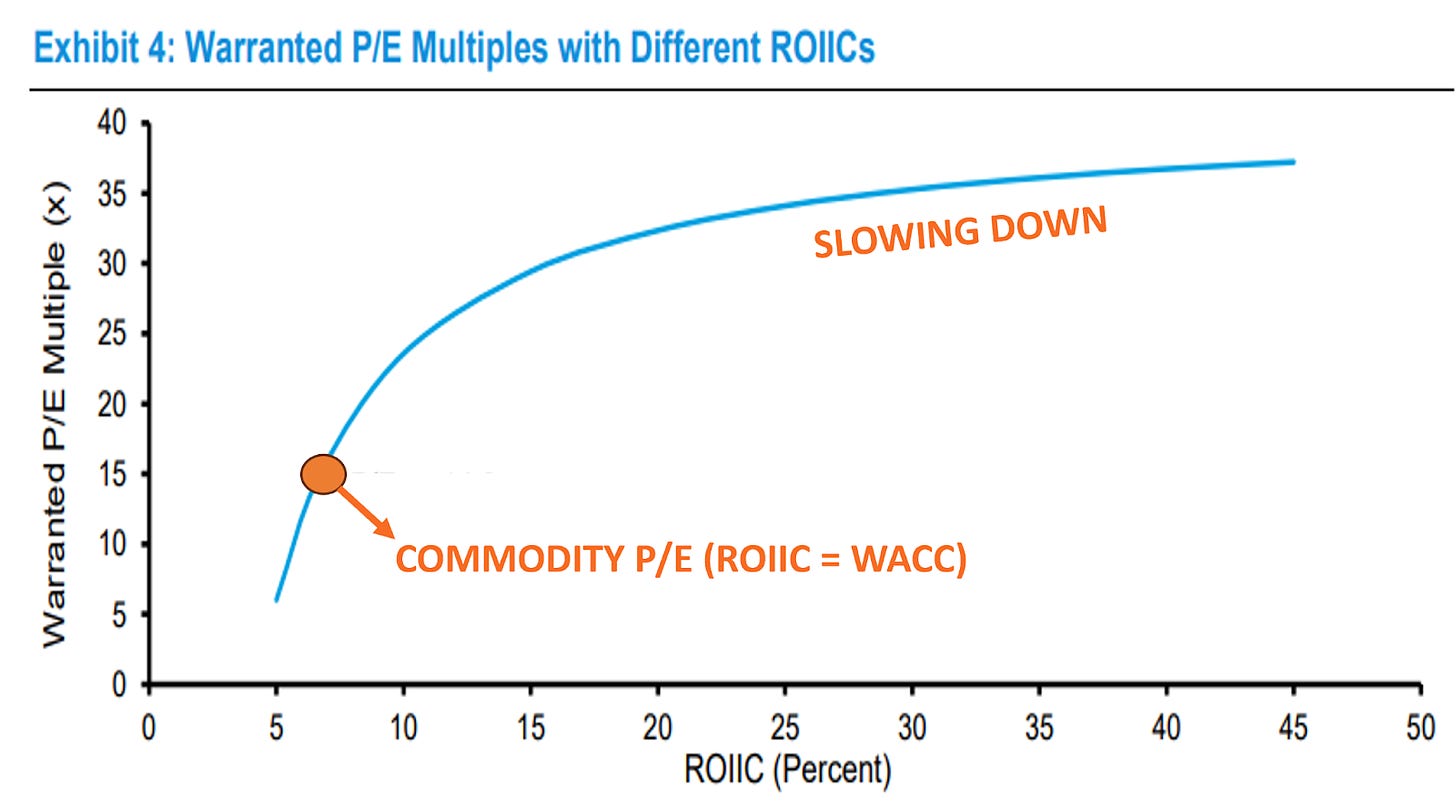
They did the same thing with a fixed ROIIC using a fixed NOPAT growth rate and changing ROIIC:
Increasing ROIIC above the cost of capital rapidly increased the P/E ratio. The rate changes at 15% and the multiple increases rate slows down.
A high ROIIC means an efficient company, you do not need to invest much to generate growth. More cash is left over for the shareholders. A low ROIIC signals a less efficient company. More investment is needed and less cash will be left over for the shareholders.
Takeaway n°10: A higher ROIIC means a more efficient company. The increase in the P/E ratio will slow down with increasing ROIIC
Duration of growth
The final driver of future value creation is the duration, in particular the duration of returns higher than the cost of capital. How long will the company sustain its competitive advantage?
What does the market imply through the P/E ratio?
Based on a past study performed by … the market implies a competitive advantage period averager about 8 years, with 5 years for very competitive industries and 15 years where there is low competition.
Estimating the growth profile of a company is related to the industry and the amount of competition within it. Industries with a lot of competition will have a quicker reversion to the mean and therefore deserve lower P/E ratios. We go back to the beginning, the competitive life cycle:
Takeaway n°11: The final driver of value is the duration and its ability to generate excessive returns. Be careful when forecasting this time frame.
Conclusions
The P/E ratio is a shortcut to the valuation process. All factors that drive the P/E ratio are implicit within it.
A discounted cash flow makes these drivers explicit.
You may not like a discounted cash flow because the results can vary widely on the inputs you choose. But more important is the reasoning and the process of the discounted cash flow, not the results in itself. All assumptions you make will be made explicit which will help you improve the accuracy of your forecasting.
Impact on the 100-bagger checklist
What does this mean for our 100-bagger checklist?
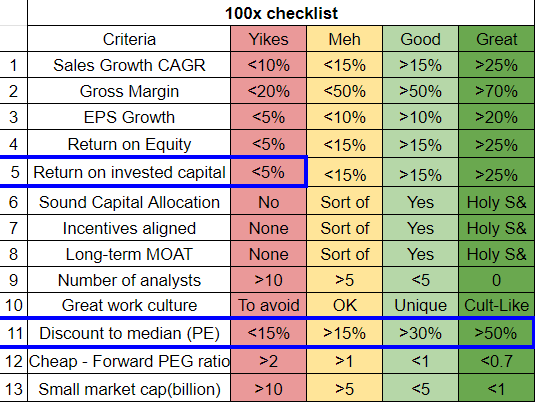
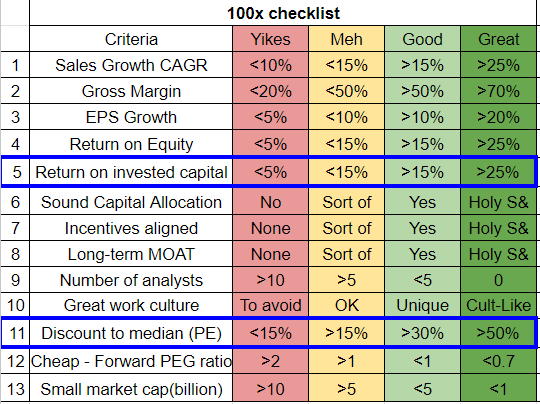
In the checklist, we use the P/E ratio of the company compared to the median P/E ratio in its industry to give us a notion that it is trading below its competitors in the market.
The idea was to quickly check the relative pricing. As you know, a 100-bagger is the result of EPS growth AND P/E ratio expansion in the market.
The twin engine of the makings of a 100-bagger as Chris Mayer says it.
In other words, for the moment, we won’t change that in the checklist, however, we need to be mindful of what it really means. In other words:
If the ROIC is low AND the discount to median PE is high
Then the low ROIC can be one of the drivers for the lower PE ratio in the market
However, if the ROIC is high AND the discount to median PE is high
Now we need to take a closer look. What are the other reasons why it could be trading lower than its peers? Maybe we’re lucky and have found a quality company trading at a low price!
Here you can download the 100-bagger checklist.
Thank you for reading. If you have any questions, do not hesitate to contact me.
May the market be with you!




Hi Kevin,
a very interesting article.
Could you share the reference to the Mauboussin study that you refer to between Takeaways 8 and 10?
- if you have it ready at hand that is
Thank you very much in advance