6 things I learned about ROIC and how it can help identify a 100-bagger (applied to Inmode Ltd)
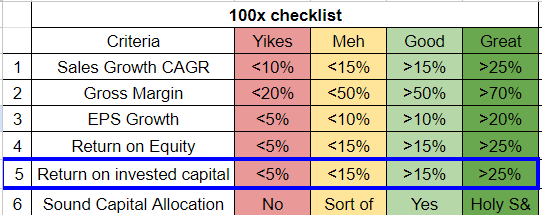
In a previous article, we introduced the 100-bagger checklist (download it here). Let’s zoom in on one specific check within the check-list: Return on Invested Capital
I’ve been using ratios like ROIC for a couple of years now. But I never really took the time to dig a little deeper into its importance and to understand in more detail why this is such an important metric.
It’s a ratio that is used by a lot of famous investors:
Warren Buffet
Joel Greenblatt
Pat Dorsey
The primary input for this article was written by Michael Mauboussin and Dan Callahan. Credit goes to them. You can find their reports here.
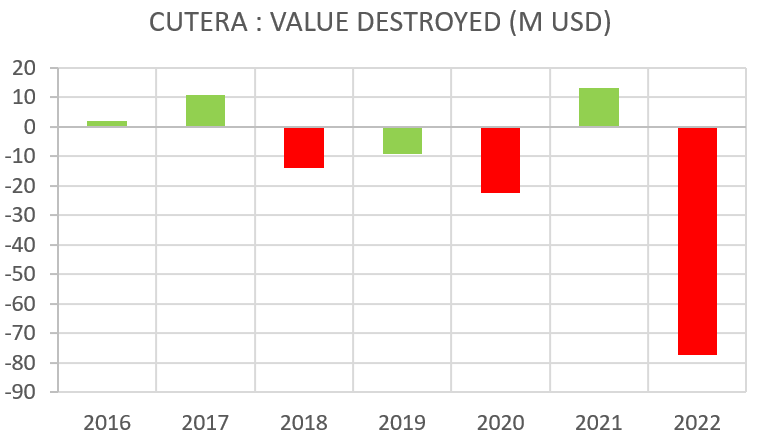
Update 18/9/2023: This article was updated because the charting for the value destruction at Cutera had a mistake. Thank you to Harsh Deepesh Shah (@hds1707) for spotting it!
What is the point of ROIC?
One core test of success for a business is whether one dollar invested in the company generates value of more than one dollar in the marketplace.
Warren Buffet calls this “the one-dollar test.” He wrote about it in his 1983 shareholder letter:
"We test the wisdom of retaining earnings by assessing whether retention, over time, delivers shareholders at least $1 of market value for each $1 retained."
The goal is to verify if the company is creating value or destroying value in the market.
If a company is creating more value year after year compared to its competitors, then it probably has some sort of competitive advantage.
Imagine you’re a CEO or CFO, and you have several capital allocation decisions you can make. You’re going to look for opportunities that have a positive return on investment for the business. However, as an investor, you want this positive return to be reflected in the market. That is why Buffett mentions generating value in the marketplace.
Here’s a simple example where the management team decides to spend CAPEX to buy a new factory and increase production capacity.
Say a new factory costs 1000 dollars, and the cost to finance it, the cost of capital (WACC), is 10%.
If the new factory generates 80 dollars in after-tax earnings, forever, you can calculate the present market value as:
Present Market Value = yearly cash flow in perpetuity/cost of capital
So the present market value would be 80/0.1 = 800 dollars. The management team has destroyed value in the market. If on the other hand, the factory would generate 120 dollars in cash flows, then the present value would be 1200 dollars, and value has been created.

A great capital allocator is someone who can:
Invest with a ROIC greater than the cost of capital (efficiency)
Is able to deploy sufficient invested capital (magnitude)
The value created = Invested capital x (ROIC - WACC)
Throughout this article, we’ll use Inmode and its competitor Cutera as an example. To provide some context:
Inmode and Cutera sell minimally invasive and non-invasive aesthetic treatment devices. Inmode sells these directly to physicians. Physicians use the devices to perform treatments like:
Skin smoothing
Face lifts
Skin tightening
etc
Let’s first dive into how ROIC is calculated and its definitions. You can skip this part if you already know how to.
How to calculate ROIC
Here’s the general definition:
NOPAT or Net operating profit after tax is one of the most useful numbers in finance and investing, but it does not appear on an income statement. You can calculate Free Cash flow by subtracting investments (for a Discounted Cash Flow). IC is the capital invested to generate that NOPAT.
Calculating NOPAT
On an income statement, you will find:
Operating income = earnings from Operations
Earnings Before Interest and Taxes (EBIT) = which includes other income/expenses
Net income = the bottom line
You’ll need to calculate the NOPAT yourself (or maybe some websites do it for you).
NOPAT measures the cash earnings of a company BEFORE financing costs. This is interesting because when comparing the NOPAT of two companies, the financial leverage (debt) they have will be leveled.
NOPAT equals earnings before Interest, Taxes and Amortization (EBITA) minus the cash taxes related to EBITA.
So take the EBIT from the income statement:
Add back Amortization to get EBITA
Remove income tax provision (which you pay in advance)
Add deferred taxes (which you’ll pay in the future)
Remove tax shield (= other income x tax rate)
Imagine company A has no interest payments or income and company B is levered and may have some income from short term bonds or something.
The Tax shield for Company A = 0 because other income = 0
The Tax shield for Company B = net other income x tax rate
You are thus ‘correcting’ the NOPAT for company B as if it is completely equity financed in order to compare the two companies.
Here’s an example, based on data we’ll gather directly from Yahoo Finance.
We’ll take the company INMODE and its competitor CUTERA as an example.
These calculations are based on past data. If you want to model the future value of the company, and you would like to use NOPAT, then you can:
NOPAT = EBITA - EBITA x cash tax rate
Usually the cash tax rate is slightly below the stated tax rate in the annual report.
Calculating invested capital
Invested capital is:
The amount of net assets a company needs to run its business
The amount of financing needed to supply funds to these net assets
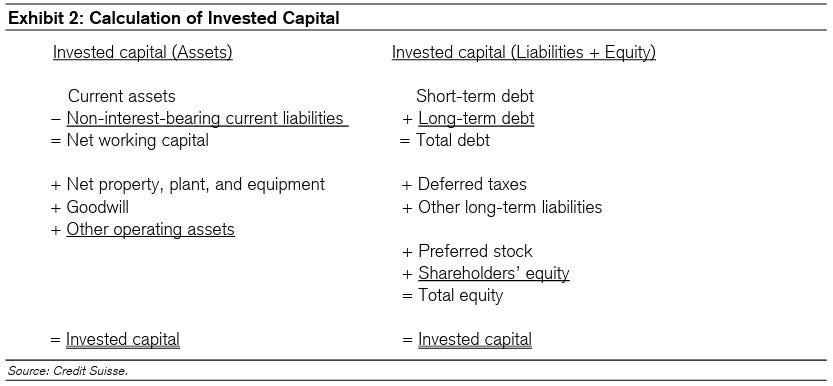
So you can calculate the invested capital from both sides of the balance sheet:
The basic question to ask yourself: What is the invested capital they need to generate their NOPAT?
At the minimum, the net working capital is the cash the company needs in the next twelve months. You take all the current assets and remove all non-interest-bearing current liabilities. In other words, all current liabilities that are not debt.
It also needs the Property, plant and equipment, maybe some intangibles and other assets.
We apply this to the financials of INMODE:
Calculating ROIC
Now that we have the NOPAT and Invested Capital for Inmode, ROIC becomes:
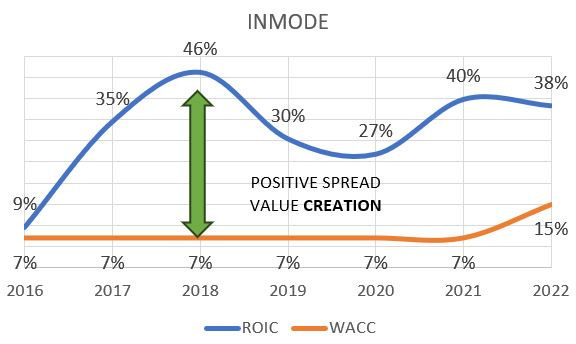
In other words, Inmode has a pretty good return on invested capital. The magnitude of the ROIC on itself has no real meaning. The goal is to look at the difference with the cost of capital. Let’s look at the spread:
Based on this indicator alone, Inmode passes the one dollar test. It is creating value in the market.
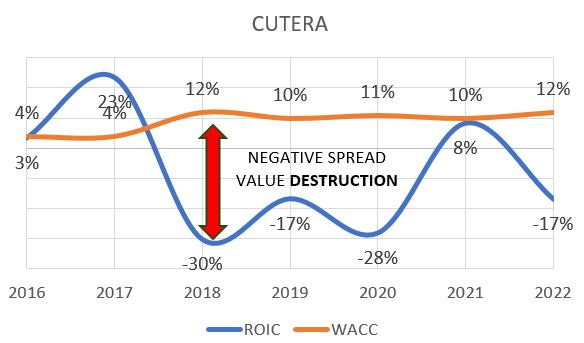
Inmode’s competitor, Cutera didn’t always pass the one dollar test in the past:
And what about Goodwill?
Goodwill appears on the balance sheet when a company acquires another. Do you include it in the invested capital calculation?
The numerator and denominator have to be in harmony.
If the company is a serial acquirer, you take the NOPAT and divide by invested capital including goodwill
If the company did a one-time acquisition, you’ll need to distinguish the operating profit from the acquired profit and divide by invested capital without goodwill
Inmode has no Goodwill.
What about cash?
Some companies accumulate cash or cash equivalents on their balance sheet.
Let us take a look at Inmode again.
Inmode has 450 million dollars in short term bonds sitting as cash on their balance sheet. It is not participating in the operations of the company. You could then, if you want to compare the company to one of its competitors, remove this excess cash from both companies, and compare ROIC in that way.
Here’s the ROIC adjusted for cash.
Here’s the adjusted for cash ROIC for INMODE:
I used this data from gurufocus to avoid having to calculate the WACC in this article. But you can immediately see that ROIC calculated by gurufocus is even higher. We only excluded the short term investments. Inmode has additional liquid cash on their balance sheet. We should estimate how much cash Inmode needs to operate its business and then exclude the rest.
Inmode is a very extreme example of an efficient company. The cost of capital for Inmode, according to Gurufocus is about 15%
There are other considerations like Minority ownership, share buybacks, Operating leases and Capex R&D. We’ll discuss these in future articles.
ROIC is an important parameter, but the way it is calculated may differ on different websites.
You have 2 options:
Use 1 source only: understand how it is calculated, and always use the same source for information
Calculate the ROIC yourself in a consistent manner
Value creation or destruction
When ROIC > WACC, the company is generating value. Inversely, it is destroying value. But this percentage tells us nothing about the actual magnitude.
If a company has an invested capital of 100 million, and it returns 20 million in NOPAT, and its cost of capital is 10%.
It’s ROIC = 20/100 = 20%
Spread = ROIC - WACC = 20% - 10% = 10%
Actual economic value created = 10% * 100 = 10 million
Therefore if company A and B have the same spread, but company A has a more invested capital, then it will create more value.
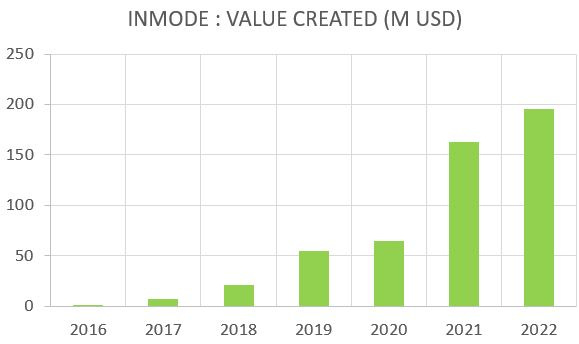
We can now calculate the amount of value Inmode has created.
Historical value creation at Inmode:
Historical value destruction at its competitor Cutera:
The link between ROIC and MOAT
The base idea is that you can use ROIC as a parameter to look for a MOAT in a company. You can do divide the ROIC into two parts using SALES:
ROIC = NOPAT/SALES X SALES/INVESTED CAPITAL
NOPAT/SALES = NOPAT Margin
SALES/INVESTED CAPITAL = ASSET Turnover
A business like Walmart has high asset turnover but low margins. Ferrari however has higher margins but lower turnover.
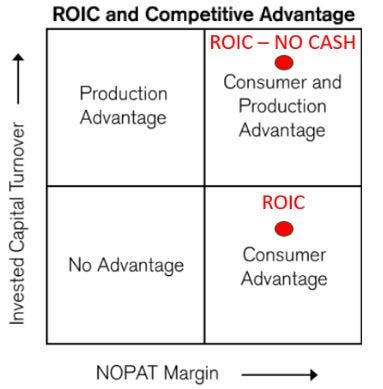
Let’s look at what this looks like for Inmode:
Inmode has managed to increase its NOPAT margin over the years. However the asset turnover, which is high when we exclude cash, will reduce to 1 if we include the cash. Here’s what it means when looking at competitive advantages:
We could conclude that at the least, Inmode has a consumer advantage, in particular, the switching cost.
The devices Inmode sells to physicians are not cheap. For the physician it is an investment into its business. The Inmode Evoke, for face lifts, has a starting cost of about 40 000 dollars.
The adjusted ROIC signals there may be a production advantage towards competition.
Inmode outsources production, but it holds the patents and intellectual property for the technology they use in their minimally invasive and non-invasive aesthetic treatments devices. This could be seen as a competitive advantage as it sets a barrier to entry into their niche market.
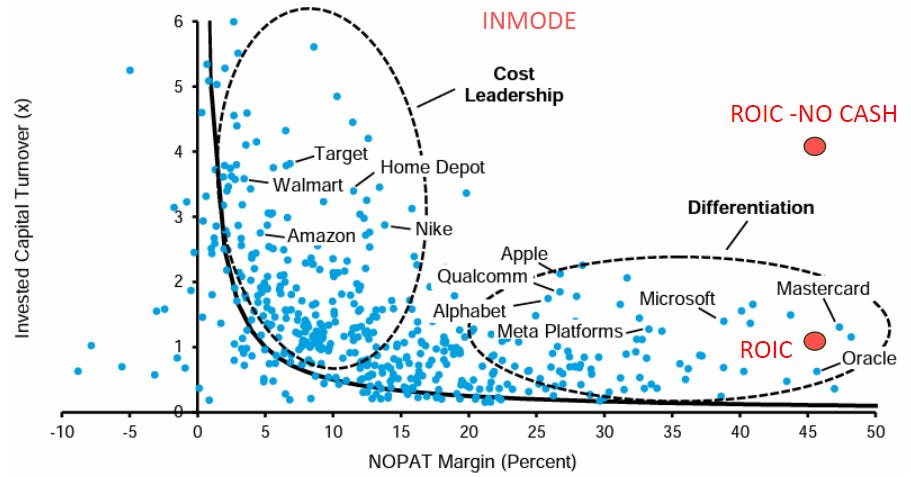
In Michael Mauboussin’s ROIC report from 2022, they plotted the top 500 US companies and calculated their NOPAT margin and Asset Turnover. We’ve added the data for Inmode on top of the graph:
It is the same reasoning as before, but worded differently. Inmode is more a differentiator than it is a cost leader.
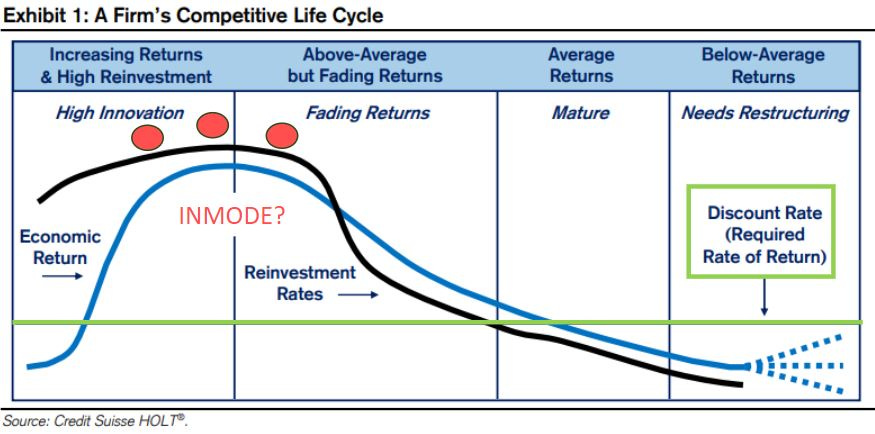
The competitive life cycle
If a company can generate excess returns over the cost of capital, during several years, it may have a competitive advantage. You can then try to find and discover what this competitive advantage might be.
But, all companies eventually revert to the mean because of competition.
Example: Nvidia is earning high returns at the moment, well above their cost of capital. They are the market leader and have an edge compared to their competitors.
These competitors see that a company is earning a lot of money. They will now want a piece of that pie, and offer similar solutions in the future. Once more and more competition enters the market, Nvidia’s ROIC will decline.
In the end, ROIC will match the cost of capital. There is no longer any value that is created.
It is possible that Nvidia has such a competitive advantage that it will continue to earn these returns long in the future. A MOAT analysis can help uncover these.
In order to do accurate future projections, it is useful to think about where a company is in its life cycle. Will it continue performing well, or will ROIC decline towards the cost of capital? Where is Inmode situated?
Inmode has seen a lot of growth in the past. They have been dominant in their niche. My guess is that they will continue to grow but not at the rate shown in the past. They will however keep generating a high ROIC in the coming years, so I would place them somewhere in the high innovation area but closer to the ‘fading returns area’.
The 6 main takeaways
As you’ve seen, there is a lot to discuss, a lot of nuance related to one single financial ratio.
My main takeaways are:
Always use the same source for ROIC or calculate it yourself in a consistent manner
Analyze the historical spread to get an idea of competitive advantage
Display value creation or destruction to get a quick idea of the magnitude of value creation, instead of just the efficiency
Decompose the ROIC to search for clues to the competitive advantage the company may have
The absolute number of the ROIC or spread is not that important. You want to be directionally right
In the end, the ROIC will always revert towards the cost of capital due to competitive forces. Be aware of this in your forecasting.
You can find the excel file with the data and calculations used in this article here.
As always, may the markets be with you!
Kevin








I have Inmode in my watchlist, your ROIC analysis make me want to look at it again, certainly the specialty chemical industry is interesting and highly fragmented. Do you own Inmode? Who are its peers? And what does it do better than them?