Unlocking 633 Billion USD - The cash conversion cycle and why you should care as an investor
Cash is king
As investors, we use earnings per share, and price-per-earnings ratios as rules of thumb to evaluate businesses.
There’s nothing wrong with this.
But investing is about buying an asset with cash, and after a certain time, extracting more cash out of it than the amount you have put in.
So in the end, it’s always about cash.
Profits are an opinion, cash is a fact.
Alfred Rappaport
Michael Mauboussin emphasized the importance of focusing on cash when he wrote about the impact of the transition from the old economy (capital-heavy) to the new economy (capital-light, accounting not adapted to measure intangibles).
This was in 1999. In particular, he mentioned the importance of the cash conversion cycle.
When I read deep dives or analyst reports, the cash conversion cycle is something that I do not encounter often.
It’s worth diving in though, as JP Morgan says, there is an opportunity to unlock 633 billion USD in the US market through working capital optimization.
The cash conversion cycle is a factor in determining the quality of a company.
We’ll first discuss what it is and then apply it to the retail sector.
This will complement our deep dive on Dino Polska we wrote a couple of months ago.
What is the cash conversion cycle?
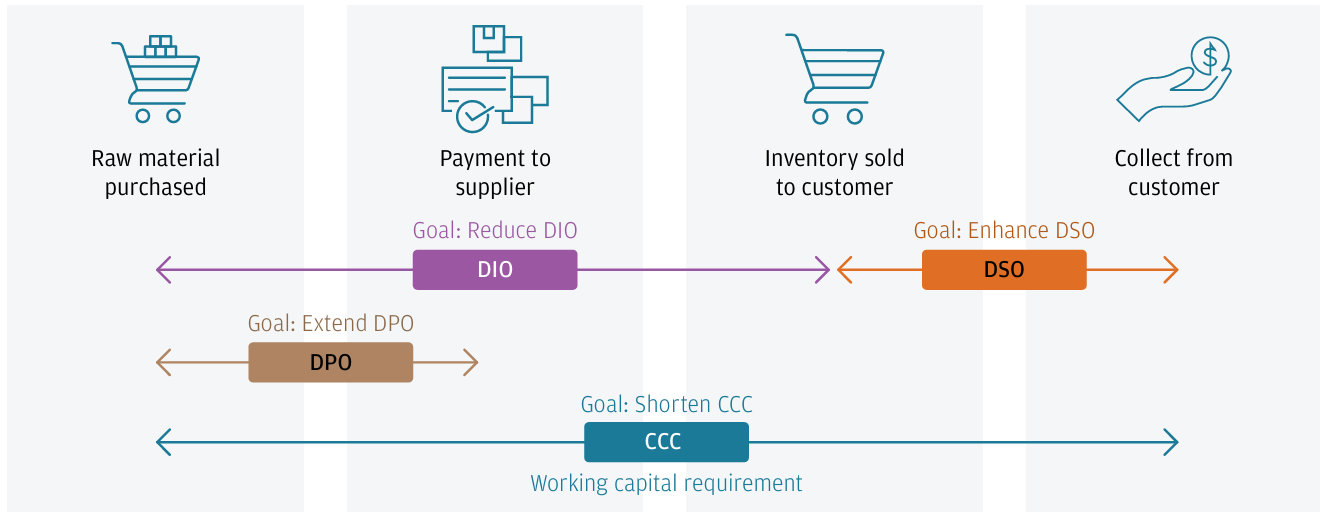
The cash conversion cycle allows us to judge how well a company is managing capital. It takes into account the drivers of working capital and the workings of the supply chain.
The cash conversion cycle is expressed in days. It shows the number of days it takes for a company to convert its inventory into cash. In other words, it measures how long each dollar spent is tied up before it is converted into cash again.
It is a measure of the efficiency of the company.
There are 3 components:
Days sales outstanding (DSO): The number of days between the moment a company makes a sale and the actual moment the cash from that sale is received
Days payables outstanding (DPO): The number of days between the moment the company receives a product or service from a supplier and the actual moment of the cash payment
Days Inventory Outstanding (DIO): The time in days it takes to convert a stock of raw materials, work in progress, or finished goods into actual sales for the company
I started to make my graph, but nothing beats the one from JP Morgan:
What are we looking for as investors?
A decreasing DIO which means the business process is becoming more efficient
A decreasing DSO means the business is receiving cash more quickly from its sales
An increasing DPO means the business pays later than when its goods were received
You can only stretch this so far, a business needs to keep solid long-term relations with its suppliers. Be mindful that margins can be impacted, usually if you pay quicker, the business might get a discount which leads to a reduction in the cost of goods sold
In the end, the final goal is to shorten the cash conversion cycle:
It can even lead to a negative cash conversion cycle which is a thing of beauty.
The working capital has now transformed into a source of cash. The suppliers are partially financing growth.
What does great look like?
Is a cycle of 100 days good? Or should it be reduced to 50? The lower the better right?
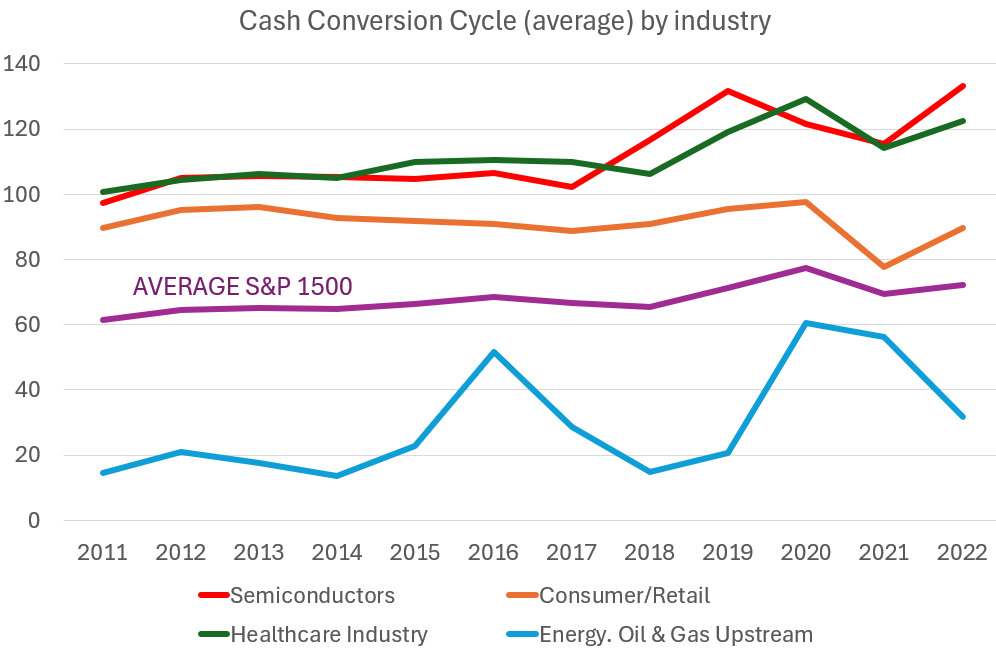
Let’s first take a look at the average value of the S&P 1500 and how it has evolved over time:
So on average, the cycle length is about 70 days and has slowly increased over the last decade.
As always in investing and finance, the best answer is, that it depends. It depends on the industry and the business.
The impact of the pandemic is visible in 2020. The cycle length of energy & oil is also a lot shorter compared to the other industries.
This gives us some sort of a benchmark.
If you were wondering, the cycle length for Nvidia at the moment is 116 days which is below the 133-day average across the industry. Even there, Nvidia outperforms.
A benchmark is good, but what we want is a negative cash conversion cycle. Most companies do not have one.
Based on data from the most powerful stock screener known to man (unclestock.com), about 10% of the companies on a worldwide sample of 60,000 have a negative cash conversion cycle.
Retail sector overview
Let us now hunt for negative cash conversion cycles, and the most typical sector to find them is the retail sector, more specifically, the bigger companies that can use their scale.
We’ll compare the following 5 companies:
Jeronimo Martins (owns Biedronka)
The idea is to look at Dino Polska’s competition and add Costco and Amazon as a reference.
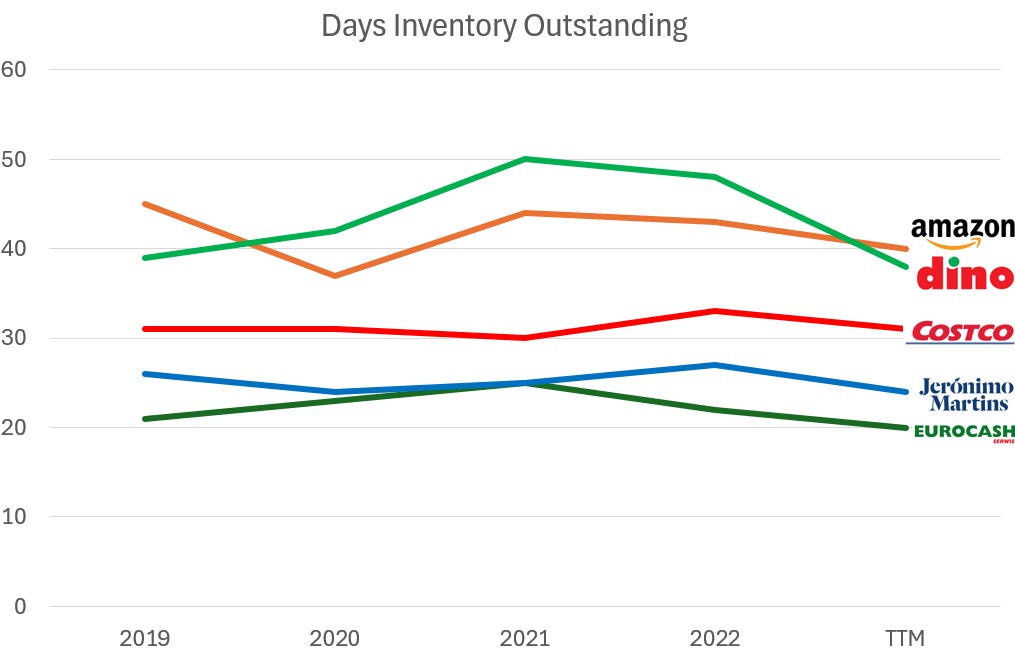
Days Inventory Outstanding
Here’s the data:
A lower DIO is better. Eurocash and Jeronimo Martins have a lower DIO compared to Dino Polska. But Dino’s has been decreasing since 2021.
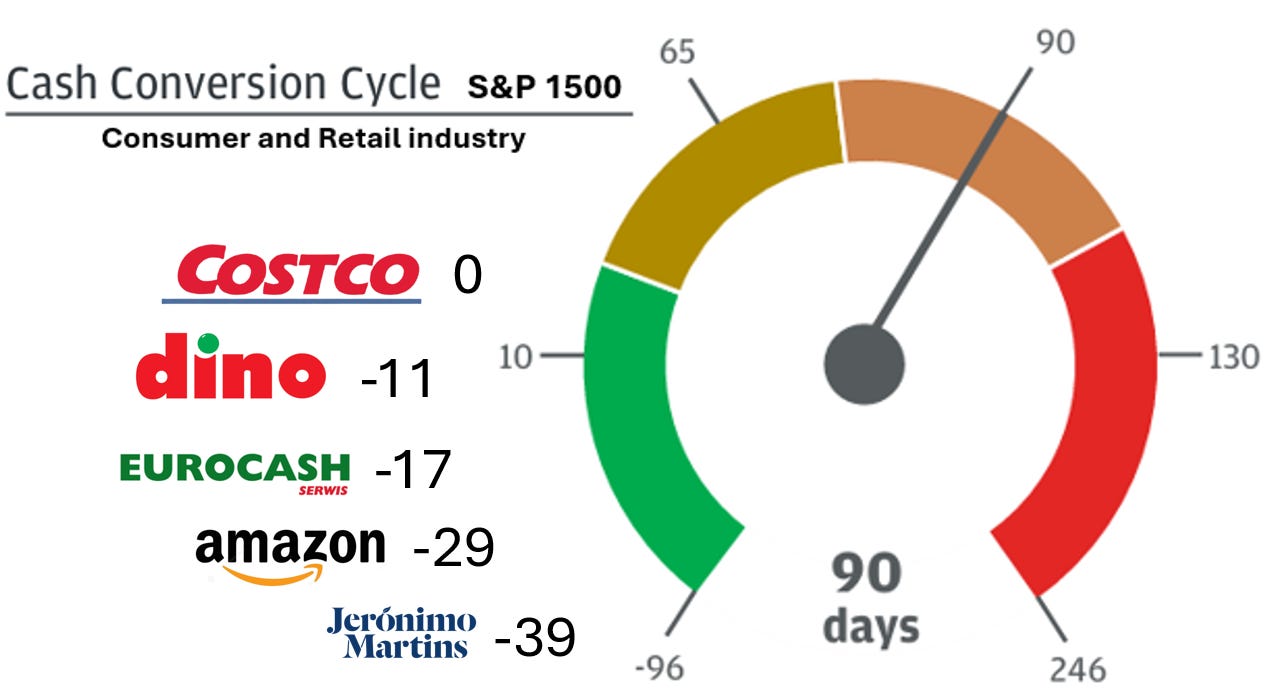
Remember the average for retail in the S&P 1500 was 90 days. The above numbers are lower and typical for big retailers.
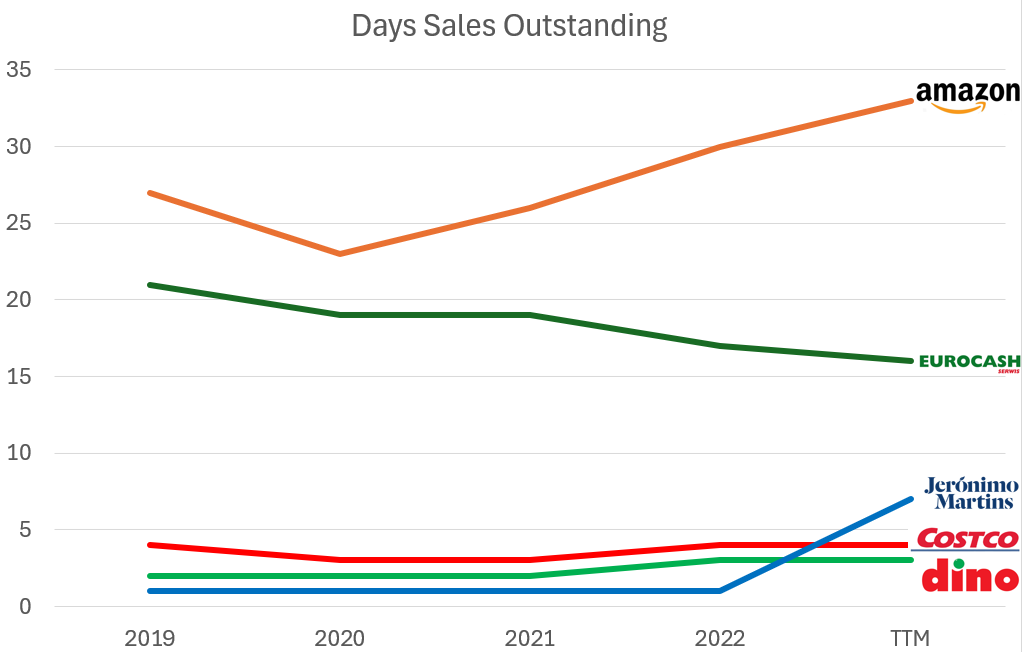
Days Sales Oustanding
For the Dino’s and Costco’s of this world, I was expecting this to be quite low. Why Eurocash is higher I can’t explain at this time. Amazon is different as it reflects the sum of different business models.
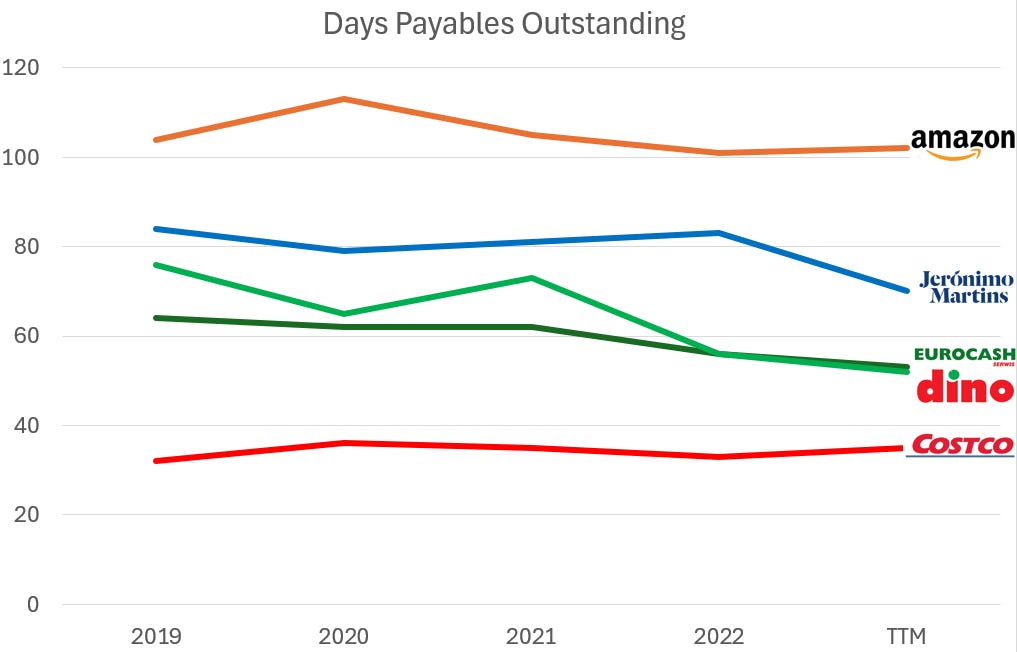
Days Payables Oustanding
Costco’s is the lowest and very stable. Notice that the DIO and DSO are also the most stable at Costco. We’ll see what the end cash conversion cycle length will look like, but Costco operates under a stable regime with its suppliers (cost versus trying to reduce the DPO even further). Amazon can use its size to have a high DPO.
Cash conversion cycle
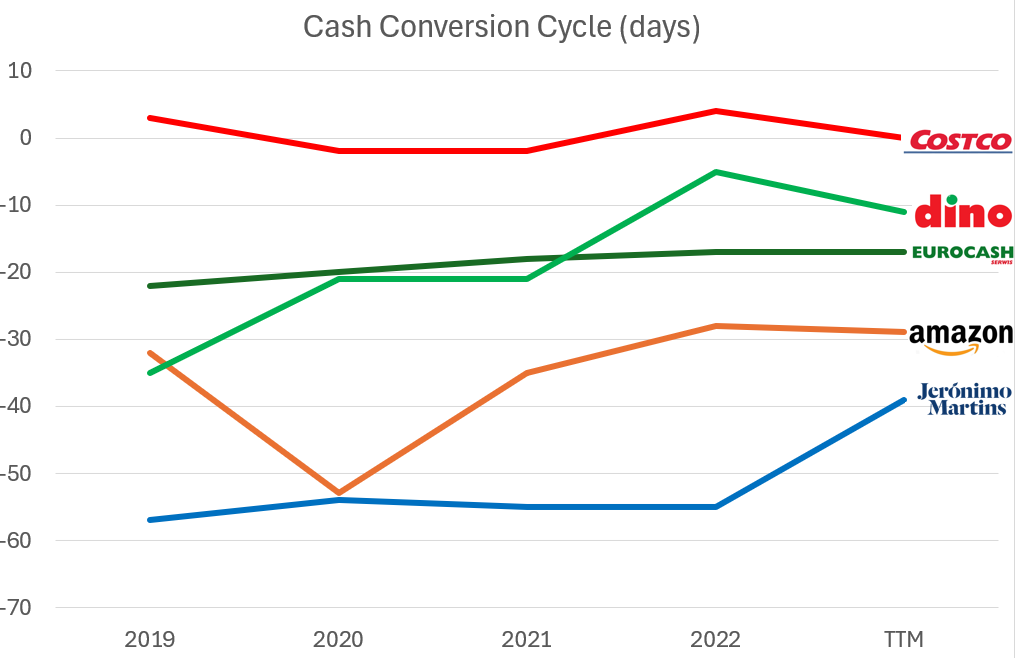
We arrive at the cash conversion cycle.
Costco’s is the highest with 0 days. I do not think it is a coincidence but by design. Dino’s is increasing and we’ll have to talk to management to see what the reasons might be. Amazon had a dip during the COVID year and Jeronimo Martins (owner of Biedronka) has the lowest of them all.
When comparing to the overall retail for the S&P 1500, this is what the final picture looks like:
Conclusion
Working capital management and the cash conversion cycle are important aspects to evaluate when analyzing a company.
It is one of the factors that show how efficient a company is in managing its working capital.
Value can be unlocked in companies that are gradually improving their cash management.
I’ve added the following questions to my investment checklist:
What does the cash conversion cycle look like?
How does it compare to its industry and its competitors?
How has it evolved over the years, is it increasing or decreasing?
What can the company do, or is it doing to improve its working capital management?
What did I miss?
Thank you for reading, and as always,
May the markets be with you
Kevin
Further reading
Other interesting articles on the cash conversion cycle






Nice article Kevin.
I’ve never heard anyone talk about the cash conversion cycle before, but it does for sure paint a great picture of the health of a business. Fluctuations in these numbers are likely always for one reason or another that investors need to know.
Hi Kevin,
as usual a thoughtful and interesting article.
I myself like the CCC very much as an indication of potential competitive advantages and checking its components and where they are trending over time
Note, fwiw (I am a computer scientist, no economist and have no track record to speak of) I wrote two articles on how I believe the CCC should be extended: I find it deficient in the aspect of catching float-style businesses, e.g. subscription businesses that are being paid upfront. Unfortunately I never received feedback, so maybe it is just irrelevant (but i think it shouldn't be - also prepaid expenses shouldn't be ignored imo ...after all they all relate to cash)
For anyone interested: The latest of my articles is https://compcap.substack.com/p/modifications-to-working-capital
Have a nice weekend and thanks again for another interesting article