At the end of last year, I organized a little contest. The winner got to pick a company that I would dive into: Lovesac
Let’s go!
Who is Lovesac?
Lovesac operates in the furniture retail market and delivers a unique product in the seats and sofas category. It has been growing fast (in a slow-growing market) over the past years. It offers a premium product in the higher price category.
How does Lovesac make money?
Lovesac develops and designs modular durable couches. Lovesac creates an omnichannel customer experience. In other words, Lovesac's focus is on:
The branding
The design(patented)
The customer experience
Manufacturing and distribution are outsourced. 60% is produced in China. The rest is made in the US. (customers can choose the US-made but will pay a premium). Distribution is outsourced as well.
They have suppliers in China, Vietnam, Taiwan, India, Indonesia, Malaysia and the US.
They employ an asset-light business model. Warehouses and showrooms are leased.
To pivot away from traditional furniture, they have designed the lovesactional, a sofa comprised of modular parts that should last forever.
The customer makes an initial purchase. If after a few years, they grow tired of the look, they can buy covers or accessories to make their sofa look different.
It all started with sacs, big sacs:
Then they patented and made the sactional. Here’s a video on how this works:
And here’s a photo of the real thing:
Here’s the revenue evolution over the years by segment:
In other words, the sactionals were a huge success. That’s about a 7 times revenue increase in 6 years. 90% coming from the couches.
We can plot the same thing by sales channel:
Where we see a gradual increase in sales from 2018 to 2020 with the COVID-effect visible in 2021 where suddenly half of sales were done online.
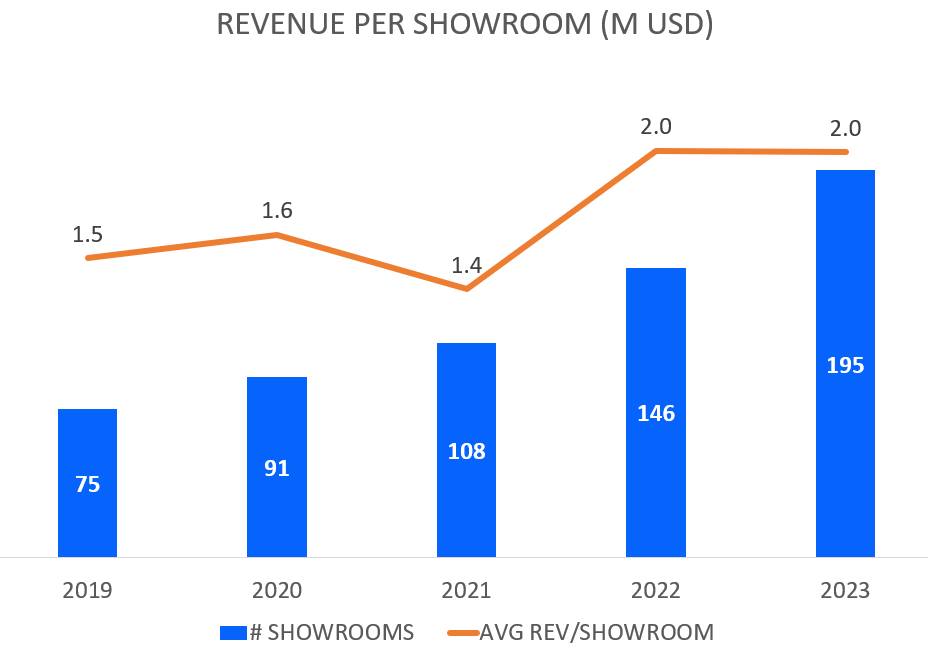
The number of showrooms were increased significantly in 2022, and this shows in the revenue breakdown. Below is a view of how the number of showrooms has evolved and what the average revenue per showroom looks like.
Their annual report states that they have had to shut down certain showrooms for lower performance.
Notice that the company added 50 showrooms in 2023 but the impact on revenue was less pronounced than from 2021 to 2022.
So the business model seems like a Gillette business model. They sell the platform once, and customers come back to buy covers or accessories.
But the bulk of the revenue we think is made by the initial sale. We do not have direct proof of this, but when a company states in its presentations that 45% of the transactions are recurring customers, this is proof of the model, but it is not 45% of revenue.
Past performance
On the sales front, their past performance has been stellar. Especially within the furniture retailing industry which is growing slowly (3-4% YOY).
But has this translated into earnings? Here’s what EBIT looks like:
The trailing twelve months take into account a great Q4 of 2022. We have no idea if those results were matched during Q4 2023.
So revenue has increased rapidly, but operating income has not continued to increase, which reflects that maybe costs have increased rapidly.
Let’s take a look at the margins.
Gross margins are stable and decent. But operating margins are quite low. The question of operational leverage then comes to mind. With the increase in revenue, it seems they haven’t been able to generate more profit on a percentage basis.
This is related to the business model. They are asset-light but also have few fixed costs, which means that when the business grows, there is in the short term, not a lot of operational leverage to be had. The only possibility would be that at the moment, a lot of the cost goes to the branding. And that when brand awareness grows, this cost can come down to increase the operating margin.
So let’s take a look at SG&A:
Which seems high, but compared to Damodaran’s industry numbers, it sits below the 70% on average in the industry. If we take the year 2022, for each 100 dollars in sales, there were 6 dollars in operating income.
Let’s take a look at the entire market.
In what market are they playing?
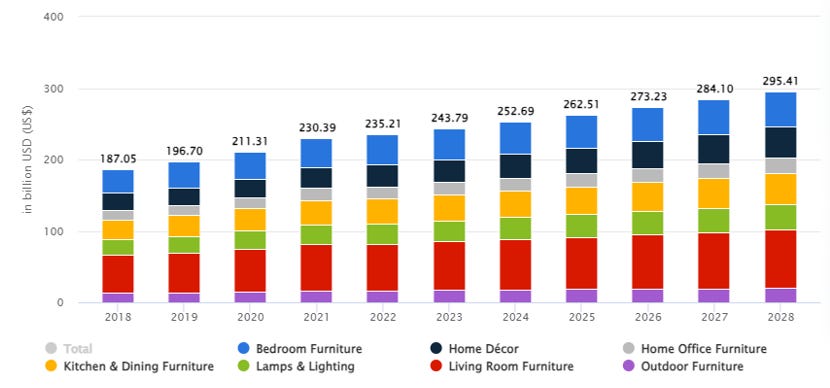
The furniture market is growing slowly. Here’s some data from Statista:
The biggest segment of the furniture market is the living room furniture which is about 68 Billions USD in the USD and projected to grow to about 82 Billion in 2028.
This means that Lovesac only holds a very small percentage of the market, despite its rapid growth.
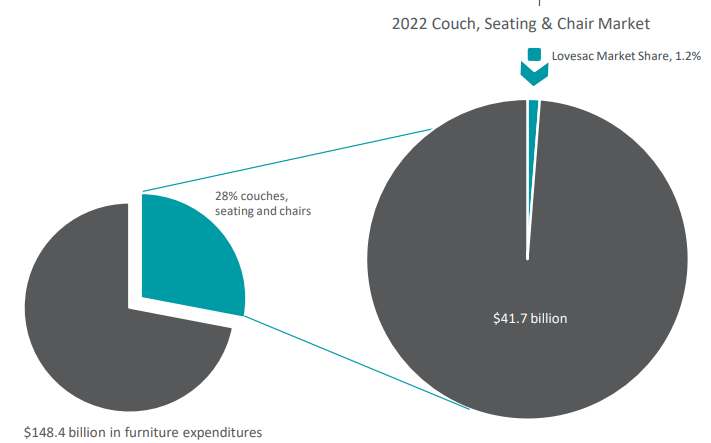
Here’s the data from their own corporate presentation:
A 1.2% market share. (If we would take Ikea, who made 6 billion USD in revenue in the US in 2022, than it would command 4% of total market in furniture expenditures).
The main players
You can download a list here of the biggest companies in the furniture space. In total, the list is 26 companies long, but not all of them are direct competitors (there are a fairly numbers of companies who sell furniture in the office segment.)
From the biggest companies in the furniture space, we’ve selected 12 companies that can be seen as direct competitors. (Ikea was not included but is of course a direct competitor)
The graph can be read as:
Sales growth: 5 year sales CAGR
Efficiency: 3 year average ROIC
Profitability: Operating margin = Size of the ball
Lovesac stands out as the fastest growing company within the industry. From an efficiency standpoint it does pretty good, however, the ROIC of LOVE on the TTM basis is a lot lower (at 5%). Finally the profitability is on the smaller size within these 12 companies.
A 55% gross margin in this industry is high compared to the competitors.
A 6% operating margin in this industry is median (50% of the companies do better and 50% do worse).
Conclusion: This is a fragmented market. A big chunk of the market is not dominated by the top 5. This also means that barriers to entry are low, and profitability on the low end (as evidenced by the above data).
How have they allocated capital?
Here their history on capital allocation in one graph:
Operational cash flow is increasing although there was a decrease in 2022
MNT capex is growing based on maintenance and remodeling of existing showrooms
Growth Capex is increasing and reflects investments made to open new showrooms
Since 2020, you can see the debt financing ratio going up, but they have almost no ‘debt’. The debt represented here are the long term capital leases
ROIC was high during 2020 and 2021 but they seem to have a problem maintaining efficiency at the moment (TTM at 5%)
Share count has grown but they have begun buyback back some stock over the last 2 years.
Does Lovesac have a MOAT?
Let’s first take a look where we think Lovesac is in its lifecyle. Here’s a typical lifecycle chart from Professor Damodaran:
We believe the company has experienced its high growth phase, and will now transition into its mature growth phase.
In other words, it has been growing rapidly revenue wise. It has showed in the last 3 years it can earn a profit (although COVID also helped with this). Based on their latest numbers, the growth is slowing down. Free cash flow is starting to get generated.
Let’s go through to our MOAT checklist.
The most important part of a competitive analysis is the barrier to entry. We can be short, there are none in this industry.
Let’s first take a look at possible production advantages:
Complexity: No.
Protection: They have patented their sactionals, although a patent has a limited lifetime, and it’s not impossible for a competitor to design something similar but not exactly the same
Resource uniqueness: No
Rate of change in the process cost: Are there technological advancements that could reduce the cost of production? No
Distribution: No, is completely outsourced
Purchasing: Scale can lead to more power to the buyer, but the problem is their business model wants to hold less inventory and print on demand. It’s difficult to get a scale advantage this way
Advertising: This is probably their best asset, the goal to create a well-known brand
And the consumer advantages:
Habit: No
Switching costs: No
Network effects: No
Conclusion: the only competitive advantage that Lovesac has is their brand and the patent protection of their product.
Here’s an extract from their annual report:
We own 31 U.S. federal trademark registrations, 177 foreign trademark registrations, and a number of U.S. and foreign trademark applications and common law trademark rights. Our registered U.S. trademarks include registrations for the Lovesac®, Lovesoft®, Sactionals®, Durafoam®, SAC®, SACS®, Moviesac®, Supersac®, Squattoman®, Total Comfort®, Gamersac®, Citysac®, Footsac®, Always Fits. Forever New®, The World’s Most Comfortable Seat®, and Designed For Life® trademarks. Our trademarks, if not renewed, are scheduled to expire between 2022 and 2031.
We have 26 issued U.S. utility patents and 38 issued foreign utility patents, that are scheduled to expire between 2022 and 2039. We have 15 pending U.S. utility patent applications, 35 pending foreign utility patent applications and 2 pending international patent applications. Our Sactional technology patents include our proprietary geometric modular system and segmented bi-coupling technology.
When a company has few competitive advantages in a fragmented market, it has to focus on operational excellence and hope for scale. The business model of Lovesac may not be adapted to this purpose.
Insider ownership
I’ve found some conflicting data on this, but insider ownership seems to be hovering at 9%.
Work culture is OK according to glassdoor. They treat their people well, but salary is pretty low.
Market Expectations
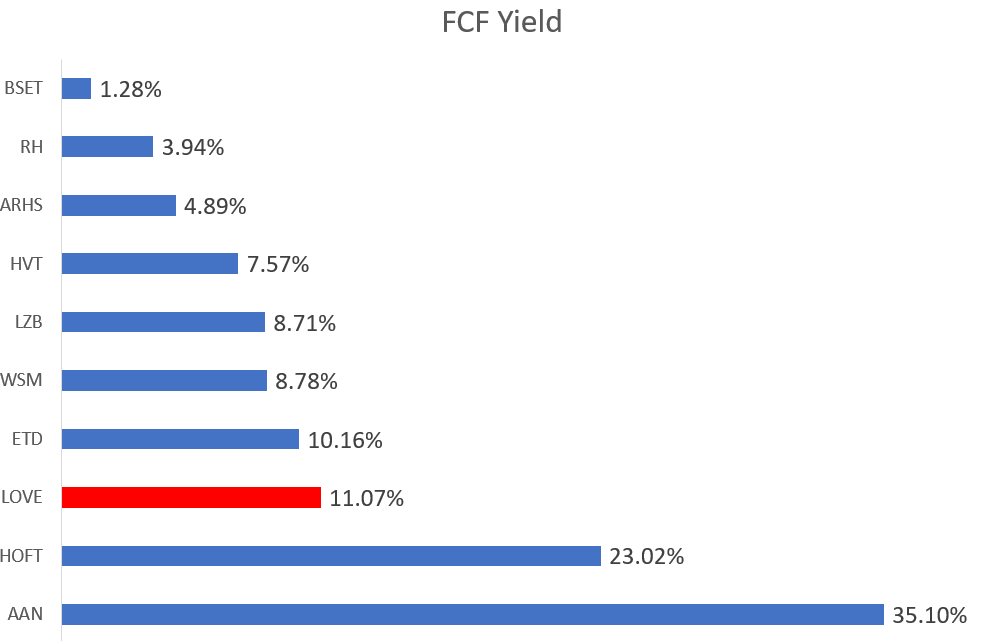
Let’s first take a look at how the different companies are trading based on a free cash flow yield:
Lovesac has a decent free cash flow yield, however, bear in mind these are TTM numbers. We’ll have to see if Q4 2023 was a least as good as Q4 2022 before rendering a final conclusion.
What are the expectations of the market-implied in the price at the moment?
We use an inverse DCF with the following criteria:
Discount rate of 15%
Exit multiple = EV/FCF = 10
Duration = 10 years
The table below shows the base Free Cash Flow and growth rate you need to get to the current enterprise value of 514M USD.
The last 2 columns show how much the cash flows over those 10 years and how much the terminal value contributes to the final intrinsic value for each assumption.
The last scenario seems more realistic in the sense that due to competitive forces, growth will slow down.
Is this realistic?
Lovesac has been growing fast in the past, but they focus on one platform (and expand it a bit by developing tech and audio within their sactionals). But it may be difficult to sustain the past growth while only focusing on 1 single product platform.
Verdict: It seems that the company is priced fairly.
What are the analysts saying?
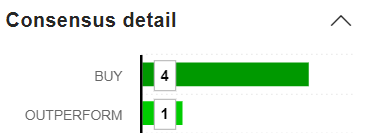
Here’s some data from marketscreener.com
With these 5 analyst almost all of them advising to buy
Destination analysis
What does the future hold?
Can Lovesac go from 600M USD in revenue towards 6 Billion USD in revenue?
Lovesac currently operates only in the US in about 40 states. There is still room for growth within the US and in their latest presentation, management has stated a possible international expansion in the future.
But remember, 6 Billion is the current sales of IKEA in the US. I do not believe these numbers are achievable as long as Lovesac holds its focus solely on the couch segment of the furniture market. The recent launch into (stealthtech/audio) only increases the market size by 5%.
Would the past growth have been the same without the COVID lockdown and the additional spending that was done? Probably not.
They are however creating new designs and filing additional patents. Maybe a new product line will be revealed in the future?
Summary
Lovesac has been the fastest growing company in the US furniture market over the last 10 years
It has not only grown, but was profitable
Growth is slowing down, we’ll need to wait for Q4 2023 to see at what rate
The business model is asset-light, this is great for growth, but the absence of fixed costs do not allow for a lot of operational leverage through scale
Lovesac has a strong balance sheet, capital allocation is OK.
They focus on one single product platform, but we feel without additional sales products or platforms in the future, this might impede their growth
To end this write-up, here’s the result of our 100-bagger checklist:
I you would like to dig deeper, I found this article to check out on substack:
I hope you enjoyed the read!
May the markets be with you, always
Kevin










Thanks Kevin, nice read.
I like your idea of thinking where could the firm potentially stand in 10 years. This helps a lot not "get lost" due to extrapolating some good quarters, this is a good plausibility check.
What I want to add to your WriteUp is the exceptional high Short Interest of ~28%.