Introduction
If you read my last article on Semler Scientific, I’ve started implementing a process to rank each company I analyze.
I was inspired after reading a great post by Todd Wenning over at Flyover Stocks.
All investing is relative.
Each decision has an opportunity cost. If you start picking stocks, you’ll want to do better than a 10-year government bond which gives you a quasi-guaranteed return at 3 to 4%.
The next level is to do better than a stock index.
That’s a lot harder. Few funds beat the index over the long run.
My goal is not to discourage you. But if you can buy an index fund with a long-term return of 7-8% annually, then your goal is to buy partial ownerships in companies that can return more to their shareholders on a risk-adjusted basis.
Many factors come together in portfolio construction, but the basic idea is when you are building one (or already fully invested), you only add to or switch out a position if you’ve found something better. In other words, you look for opportunities that strengthen your portfolio.
The master says it best:
It’s not that Buffett doesn’t believe McDonalds is a great business. He just thinks Coca-Cola and Gillette are better. (at the end he does mention it could be a great investment at the right price. A great company can become a fantastic investment at a great price)
If you can’t find anything better when looking around the markets, the best idea might be to add to a position in your current portfolio (or just keep sitting on your ass(ets))
So how do we implement a ranking system?
Here’s the basic idea:
You find a way to measure the quality of a company (Q): Our method: How S.P.E.C.I.A.L. is the company?
Afterwards, we look at the valuation (V). V=100% means fair value.
The Quality/Value ratio gives you an idea of how interesting the company is as an investment
Q gives you a measure of the probability of a positive outcome. The higher the quality, the bigger the chances are the company will continue to win
You use this and other criteria to rank the different investments
In theory (and hopefully in practice in the coming weeks) it looks like this:
This allows us to create a database, of all the companies we cover. It’s important to record the date as companies (and prices) change. Updating the database each quarter, allows us to see how the Quality and Value of the business change through time.
Let’s go back to the example of Semler.
We’ve tried to give a quality score to Semler using our SPECIAL rating.
Here’s the result:
We calculate the Q-value by taking the average of all 7 attributes, and Semler gets 61%. To get an idea, our current assessment of Visa puts it at 87%, so 61% is by no means a BAD company.
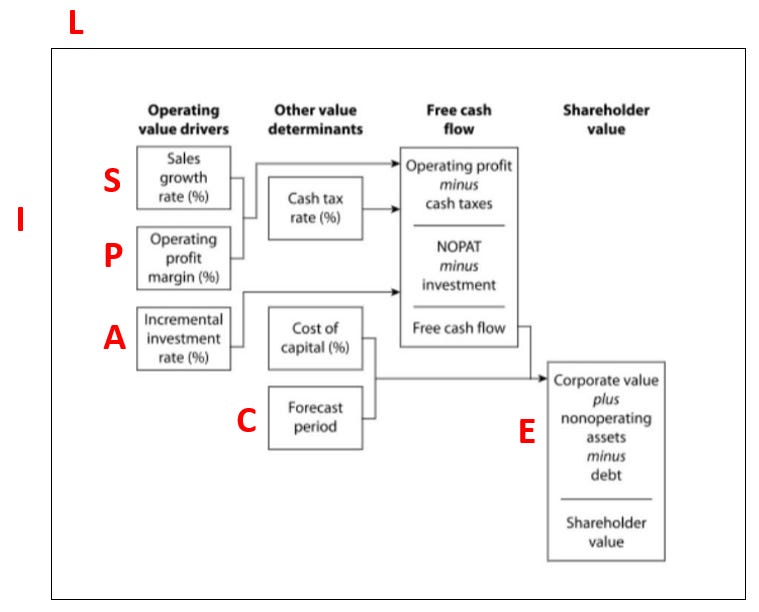
The SPECIAL method used to measure Quality is based on what creates shareholder value.
From Expectations Investing:
Sales growth rate is part of Sales Strength
Operating profit margin is part of Profitability
Debt and balance sheet are part of Endurance
The forecast period can be lengthened if Competitiveness is strong
The Industry will influence several parameters
Incremental Investment rate is tied to Asset Allocation Agility
Finally, leadership influences everything
In this first article in a 7-part series where we’ll cover each attribute, we want to dive deep into the first driver
Sales Strength
What are sales?
Revenue is the first line on an income statement. It is the result of a certain volume sold at a certain price for a mix of products and/or services.
Revenue is recognized when a contract is signed between the seller and the buyer. It does not mean the seller has received payment yet.
A typical example is when revenue is accounted for in December of one year, but since the seller allows the buyer to pay 30 days later, the cash from that sale is accounted for in January of the next year.
Revenue is the lifeline of the company, the oxygen. If Free cash flow determines the value of a company, it all starts with revenue.
As mentioned in the above graph, although the absolute value is of interest, what is more interesting is the rate of change, the growth rate.
Let’s take a look at the typical life cycle of a company:
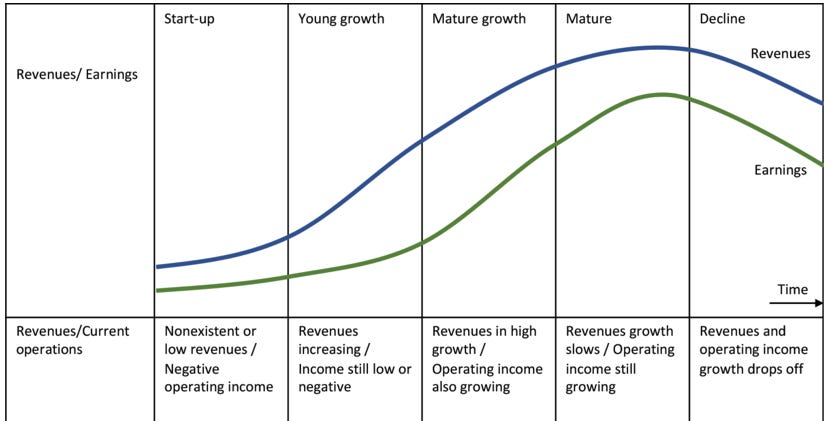
As a start-up, the sales growth rate increases until it reaches some critical mass and product-market fit, and the sales growth rate is highest in the young growth stage. Once the company starts to mature, the growth rate starts to reduce. In the mature stable phase, the growth rate further declines until growth stalls. Finally, a decline sets in with negative growth rates.
This is a theoretical framework that paints a simplified picture of the life of a company. In reality, sales growth rates can be more choppy. Or a company can go through this entire phase to then reinvent itself, and start the cycle anew.
This means sales growth accelerates and decelerates when it matures.
The Checklist
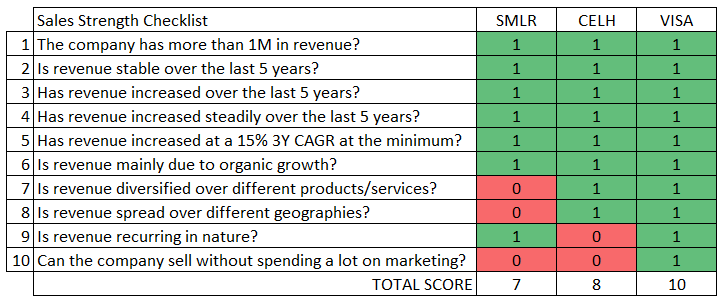
We gave Semler a 7/10 for its Sales Strength. This score is based on a 10-question checklist.
The checklist is constructed just as you would build a house. You start with a foundation and make it more and more beautiful. The more questions we can say yes to, the stronger it becomes.
It’s not the answers that make you good in the investing business, it’s the questions you ask
Gautam Baid - The Joys of Compounding
I’m looking for better questions. If you have better ideas on how we could measure sales strength, please leave a comment!
Let’s go through the 10 questions. If the answer is positive, the company scores one point.
1. Is the company generating more than a million in revenue each year?
This is the first test to see if the company is generating some revenue. I chose a million because companies that generate less should not be public in the first place.
2. Is revenue stable over the last 5 years?
As long as revenues are not in decline, the company scores a point.
3. Has revenue increased over the last 5 years?
The upward trend might be choppy, but as long as it has gone up, it scores a point.
4. Has revenue increased steadily over the last 5 years?
You can draw a line from the lower left to the top right. This company is driving sales in a more predictable pattern.
Up until now, lots of companies should at least get a 4/10. Now let's turn up the heat.
A short Intermezzo on Base Rates.
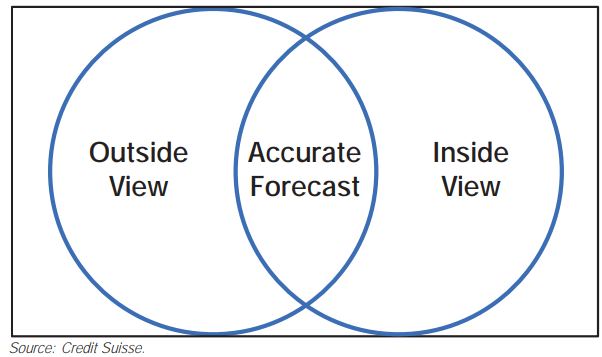
Michael Mauboussin wrote an entire book on base rates. The idea is to use reference measures from a sufficiently large sample to complement your estimates to do better forecasting as an investor. First discussed in their paper: On the Psychology of Prediction by Daniel Kahneman and Amos Tversky, they call this using the inside and the outside when doing forecasting.
Inside view: What I believe is a solid revenue growth rate based on my own experiences
Outside view: What data or other experiences can teach us about revenue growth rates
The goal is not to do any forecasting, but I want to select a growth rate that shows quality in Sales Growth but does not cut off 99% of all companies.
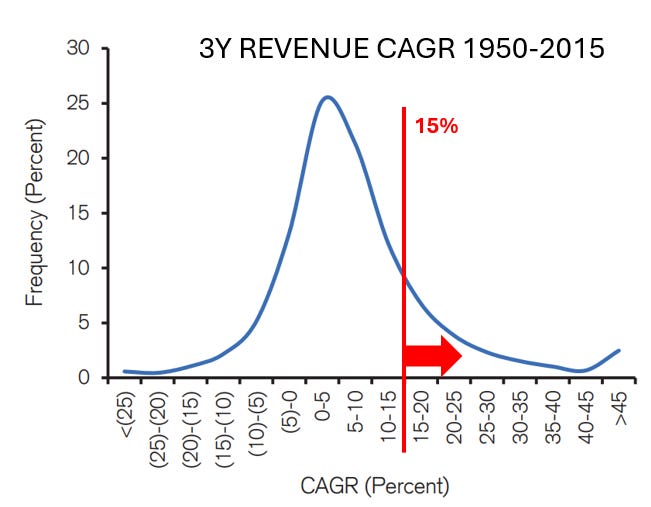
Here’s the distribution of 3-year revenues CAGR over a large sample of companies by frequency of occurrence.
Implementing this outside view, I’ve chosen 15% as a sales growth rate. It captures the 15% best when it comes to sales of the entire population.
End Intermezzo
So our fifth question then becomes
5. Has revenue increased at a 15% 3Y CAGR?
Revenue increases due to more marketing, reaching new customers, or by other means.
6. Is revenue mainly from organic growth? (as opposed to through acquisitions)
The only exception I would make to this is for pure serial acquirers. For most companies, as long as most of the revenues come from organic growth, the company scores a point.
7. Is revenue diversified over different products and services?
We do not want a one-trick pony. The company has a track record of actively developing and selling new products and services.
8. Is revenue spread over different geographies?
The company scores a point if it sells in more than 1 country. International expansion into other cultures and established markets is hard. A company that succeeds at this deserves recognition.
9. Is revenue recurring in nature?
When in some way, revenue is recurring, there is a higher probability that the future will look more like the past. Examples: The company sells through a subscription program or it sells low-cost goods that people need and are bought frequently.
10. Can the company sell without spending a lot on sales and marketing?
99% of companies need marketing to sell their product. But some companies spend extremely low amounts on it.
Examples are a product leader like Tesla or a high MOAT company like Visa which has spent less than 5% of revenue on marketing and sales.
Again, we need base rates to see what we could use as a cut-off. On average, it varies across industries, sales & marketing spend is about 10% of revenue (Coca-Cola has spent 4 Billion on 46 Billion in revenue in 2023).
If a company spends less than 5% on marketing and sales to generate revenue growth, it might have some kind of edge.
These are the 10 questions we use to measure strength in sales.
Bringing it all together
Let’s take a look at Semler Scientific, Celsius, and Visa:
Semler is a one-trick pony, only sells in the United States, and has spent 26% of revenue to market and sell their products
Celsius sells only their soft drink but in a variety of different flavors. It is now available in Canada and seeks to further expand internationally. It needs to spend a lot of marketing to sell and build its brand (20% of revenue in 2023).
Visa has the perfect sales strength. In contrast to Celsius, it has spent less than 4% of its revenue on marketing and sales.
However, Celsius has a 3-year CAGR of 116%. Does it not deserve an even higher score?
The goal is not to assign a score in line with the numeric performance (15% equals 1 point and 30% equals 2 etc.). This checklist strives for a balance between precision and simplicity.
One major drawback is that a young company with high growth in sales can never have a score higher than a 5 or 6. In addition, if the company is not making any profits, it will probably not score well on the Profitability checklist.
Our goal is to hunt for quality. This checklist is not meant for high-growth unprofitable companies. We want companies that are winning or have already won.
Finally, we add 2 bonus questions.
These are to understand how sales are flowing:
Is sales growth accelerating?
Is sales growth decelerating?
A company cannot score anything with these questions, but it’s important to recognize the acceleration rate of sales, not just the speed.
Here are 5 companies that are currently accelerating their sales growth rates. We’ve added an additional criterion of a 3Y Average ROIC bigger than 20% to screen for the higher quality ones.
What do you think of the proposed ranking method?
What would you change, remove, or add to the Sales Strength checklist?
In a future post, we’ll cover the P for Profitability checklist.
As always, may the markets be with you!
Kevin


